Using the XML API and Microsoft Excel to obtain additional reporting from Adobe Connect
Sometimes customers need a custom report that is not included in the normal reports in the Adobe Connect UI. They can obtain this data by running an API call, however the results get displayed in a browser (in an XML result set) and is not in a user-friendly format as-is. In lieu of actually building an application that can parse and display the XML in a nice format for the user to be able to display in a useful manner, we can simply use Microsoft Excel to display the data in a nice tabbed report format.
An example of this would be as follows:
Say, you want to report on what users are in a particular group within Adobe Connect, and there is no good established report to actually display this data (other than in the datagrid in the Users and Groups area)…
Here’s what you can do.
Log into the account in a browser, as an admin.
Run the following API (or any API you need to run to obtain the data you are looking for):
http://connectURL/api/xml?action=principal-list&group-id=XXXXXXX&filter-is-member=true
Where:
action=principal-list
group-id= principal-id of group you want to report on
filter-is-member=true
The results will get returned in the browser in XML format (as seen in the screenshot below):
Save the current page as an XML file by going into the browser options and select ‘Save As’ and make sure you save the page as ‘.xml’.

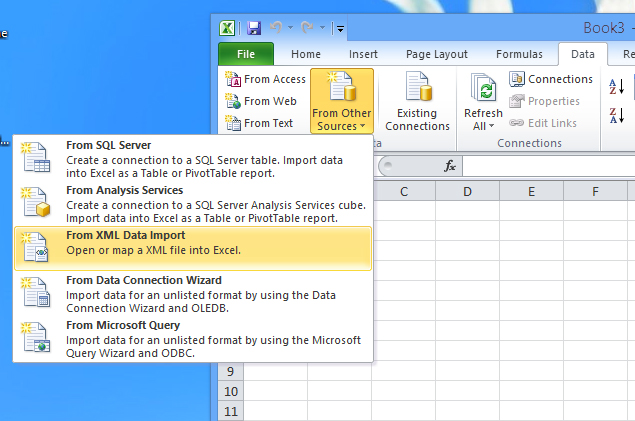
After saving the XML locally, open up Microsoft Excel (on Windows) and select Data > From XML Data Import.
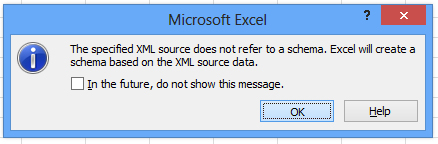
Click OK through all the next pop ups that show up after selecting the XML file and just select the defaults:

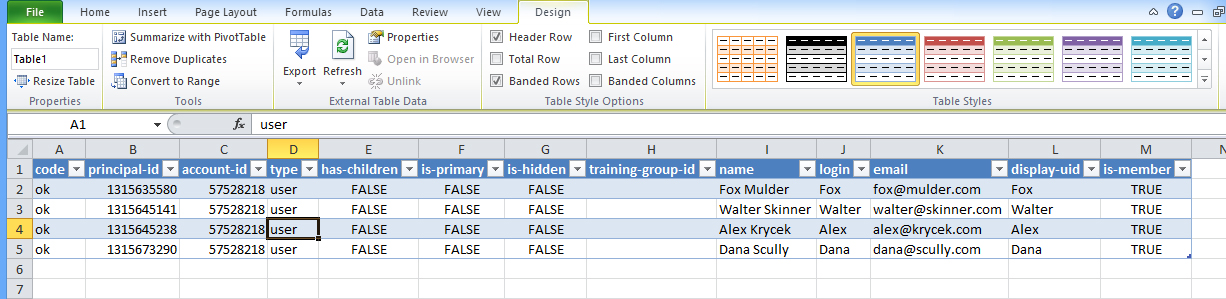
Once the data loads in the worksheet, it will be formatted in a nice tabbed display as you see below:
Thanks for the tutorial, this was really useful.