Enable Adobe Connect Flash Player Content debugging for Mac OS Google Chrome clients
Objective
This is particularly useful for debugging recording issues from Adobe Connect perspective specially in few versions prior to 9.6 where recordings only have an option to launch in flash player mode. Could be used for debugging meeting issues as well if accessed in flash player mode.
Environment
- Adobe Connect Hosted/On-Premise
- Google Chrome with MAC OS client
Steps
Install the Flash Player Content Debugger
- Goto https://www.adobe.com/support/flashplayer/debug_downloads.html#fp15 and download the installer for appropriate Mac OS version
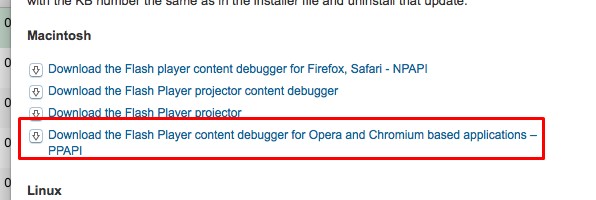
- Choose the PPAPI installer

Check the correct version is installed
- Open http://helpx.adobe.com/flash-player.html
- Click Check Now, it should show the latest build installed.
- Alternately you can run chrome://version command from Chrome browser to verify the version.
Note : It might not necessarily show that debug version is installed but the key is it should show the latest we added.
Enable logging
- Create mm.cfg file from sample instructions here : https://helpx.adobe.com/flash-player/kb/configure-debugger-version-flash-player.html
- Place the file at <HOME>/Library/Application Support/Google/Chrome/Default/Pepper Data/Shockwave Flash/System/ folder.
- You might need to search the above folder location under User Library folder or System library depending upon where Chrome is installed or permissions.
- Note, if you find the correct Shockwave Flash path but you don’t see a System folder there, create it manually and copy the mm.cfg file.
- Ensure to delete any other copies of mm.cfg(mm.txt.cfg/mm.cfg.txt) file at any other location to avoid any conflicts.
Log file location
- Open a recording or meeting in flash player to verify if logs are getting created
- They should be found under : <HOME>/Library/Application Support/Google/Chrome/Default/Pepper Data/Shockwave Flash/WritableRoot/Logs/flashlog.txt
Additional Information
Additional mm.cfg properties can be added from here if needed : https://helpx.adobe.com/flash-player/kb/configure-debugger-version-flash-player.html