I love data and if that makes me nerdy, so be it. Hopefully you find my geeky alter ego as helpful as I do. I have spent the last several weeks digging into data to uncover proof that interactivity actually leads to engagement and attention, and therefore higher content consumption rates. Last week I shared some specific engagement statistics from our five year old webinar program over the past year. This week I examine overall engagement scores and review the anatomy of the most and least engaging webinars produced within our program during the past 12 months. (For more on how Adobe Connect scores engagement, see our whitepaper ‘The Rules of Engagement’1. )
Here are the overall engagement scores from our program:
- 59% was the average engagement score for the entire program across all 20 webinars
- 70% was the highest average engagement score for a single webinar
- 45% was the lowest average engagement score for a single webinar
- 88% was the highest spike for a single engagement activity in a webinar
The anatomy of a highly engaging webinar
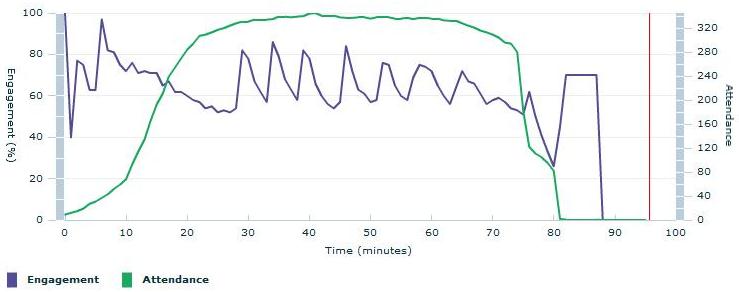
My analysis revealed that webinars punctuated periodically with engagement activities tend to have higher low points between activities, indicating that overall attention is higher throughout the webinar even between activities. This implies that the more opportunities the audience had to interact, the more likely they are to keep the webinar screen in focus and pay attention to the content delivery. I noticed that an interactive activity typically spikes engagement anywhere from 60-80%. Review the following engagement charts of three highly engaging webinars where the spikes indicate an interactivity exercise and you will see that the dips are higher than even the highest points in the least engaging webinar shown in the next section.
Note: The start of each webinar is at the 15 minute mark where attendance spikes up and the end of the webinar is at the 75 minute mark where attendance drops off. (We open the webinar room 15 minutes prior to start to allow early birds to enter and we close the webinar room 5-10 minutes after the webinar wraps up to answer any remaining questions in the Q&A.)
Example 1:
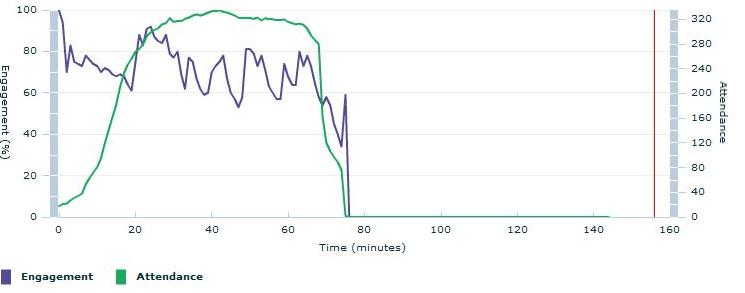
Example 2: This one got a little squished but you get the idea…
Example 3:
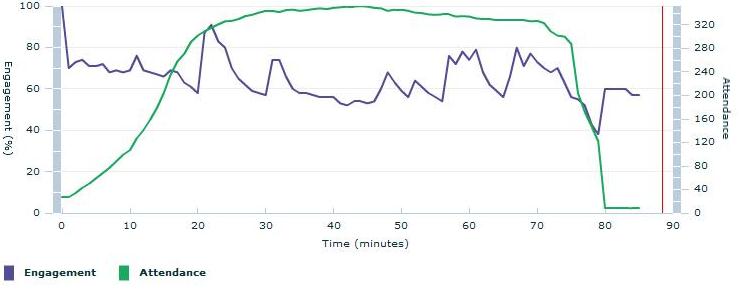
Let’s dive into the anatomy of example 3 because my alter ego thinks it’s interesting and I tend to listen to her.
18 Minute Mark: Three minutes into the webinar the presenter offered up two polls, one after the other, to get a feel for the audience’s experience, followed by three minutes of content.
22 Minute Mark: For three minutes the presenter ran a chat exercise using three chat pods by dividing the audience by birthday month to allow them to provide open answers to a question. This was followed by five minutes of content.
30 Minute Mark: At 15 minutes into the webinar the presenter grabbed attention with another open chat activity with two chats, dividing the audience by functional role and then reviewing/commenting on answers for five minutes. The speaker then presented content for 10 minutes.
45 Minute Mark: 30 minutes into the webinar the presenter opened an impressive four chats and invited feedback on four aspects of the previously presented content. Seven minutes was spent debriefing and discussing this feedback while keeping the chat open for further comments to roll in. This was followed by five minutes of new content.
57 Minute Mark: The presenter began a rapid series of three exercises where a scenario was introduced followed by a poll to gather opinions (thus the three consecutive spikes close together). This was followed by seven minutes of uninterrupted content delivery.
66 Minute Mark: Here at 51 minutes into the webinar the speaker again introduces a poll followed immediately by a new activity 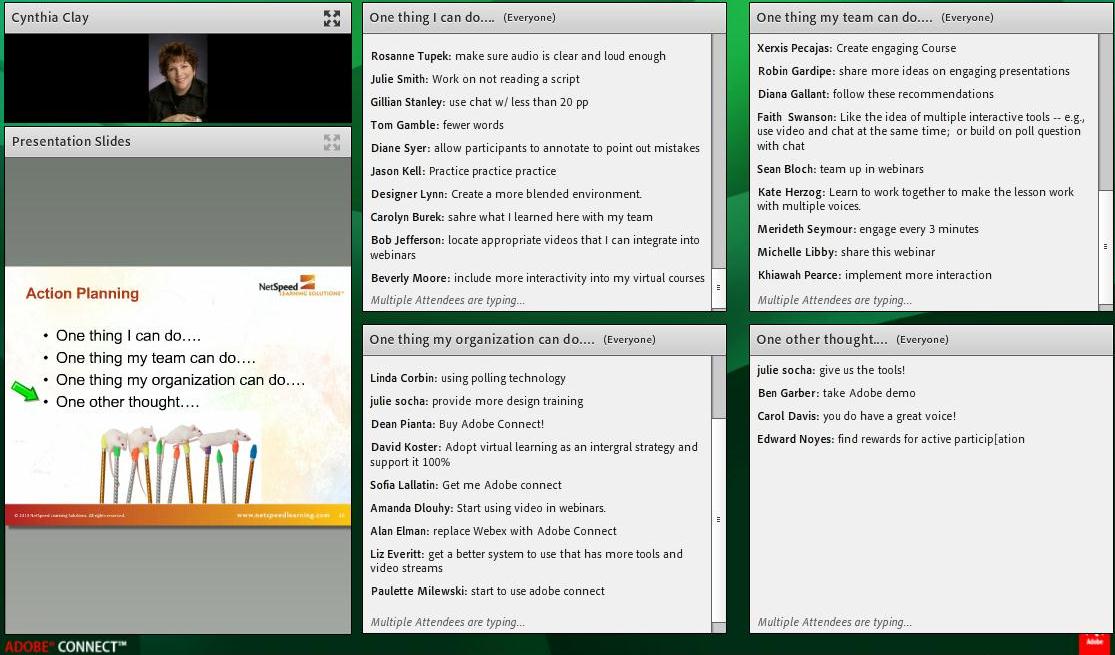 where a video is played and impressions are gathered simultaneously in an open chat for about one minute.
68 Minute Mark: The presenter gives one more learning point that takes one more minute to deliver and then opens up four more open chats to allow the audience to jot down one thing they learned from the presentation in four specific areas. This takes two minutes followed by a short conclusion and a Q&A session.
Brilliant!
If you have been following the numbers and math here you will most likely notice that the longest stretch of pure content delivery between interactive activities is 10 minutes. You will also notice that the time is almost equally divided between content delivery (PPT) and interactive exercises (which I will tell you the presenter used very skillfully to deliver many key points and was thus still delivering content during these moments). It came out to 58% content delivery and 42% interactivity.
The anatomy of the least engaging webinar
The least engaging webinar held in the last 12 months had an overage engagement score of 45%. This is the graph of engagement throughout the webinar:
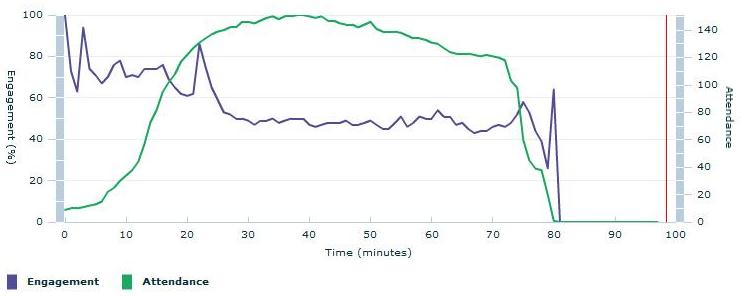
This webinar consisted of a slide deck presentation, one poll question and a short Q&A session at the end. Not as exciting at the first webinar we examined is it? The high engagement at the beginning of this webinar around the 16 minute mark on the graph was from the activity of the speaker asking attendees to type in a practice answer in the Q&A pod. The spike shown shortly after the kick off at the 23 minute mark was from a poll. Thereafter engagement plummeted to below 50% where it stayed for the duration. There were no interactive activities conducted after the initial poll.
As you can see, the baseline engagement score for webinars, like the one above, with little to no interactive activities is below 50% (with no interactivity, engagement is only scored on whether the screen is in view or not). I found this to be the case with other low scoring webinars as well – the engagement score trended toward 50% or lower after an interactive activity if another activity was not conducted relatively soon (within 8-10 minutes). For webinars with more interactive exercises sprinkled throughout, the overall engagement remained higher throughout the webinar, even between activities. You can also observe on this graph that the audience started dropping off 30 minutes into the webinar presentation whereas attendance remains level throughout the entire 60 minutes in highly engaging webinars.
The basis for this study:
At Adobe we have a very extensive webinar program as part of our content marketing and lead generation efforts throughout the organization for various products. For the Adobe Connect product alone we hold about 20 webinars every quarter – a mix of thought leadership webinars, product demo webinars, and training webinars. This study was conducted based only on the thought leadership webinars within the Adobe Connect program produced within the past 12 months. All webinars were conducting using Adobe Connect webinar technology.
1 Basically the engagement score in Adobe Connect reflects whether the webinar room window is in view for the attendee as a baseline and then adds explicit engagement points for whether attendees participate in chat, Q&A, file downloads, polls and use of emoticons.