Engagement is the most important aspect of any webinar and is what makes them so effective. Therefore, marketers need to find ways to quantify engagement throughout their program in order to gauge effectiveness and quality of content (which includes delivery).
I studied 20 thought leadership webinars in our own program that were conducted over the last year with 16,558 registrants, 5,750 attendees and 9 different speakers. This program has been running for five years and has been optimized extensively along the way. I have broken out each specific engagement activity. My numbers are in line with, or a bit higher than, other industry standard benchmarks I’ve seen.
As you evaluate your own existing webinar program or new program for engagement health and effectiveness, consider including similar engagement statistics in your analysis.
51% average registration conversion (page views/landings to completed registration)
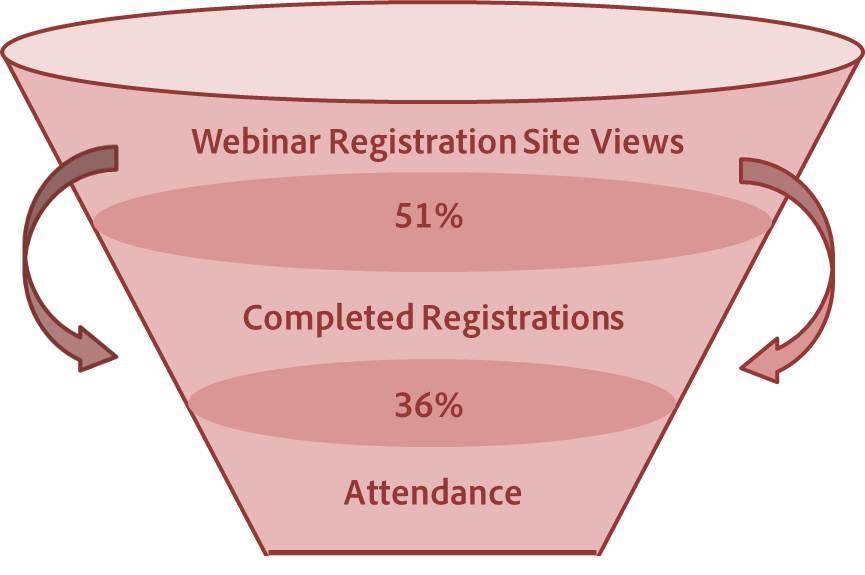 The conversion of a site visitor to a registrant has two main factors – whether the full description of the event matches the expectations set in the promotion and the length/complexity of the registration form.
36% average attendance rate
This rate is pretty standard (perhaps even on the high side) for most webinar program benchmarks (industry standard tends to be 30-40%). This rate can be impacted by whether the registrant has an Outlook calendar invite with a reminder on his/her calendar, whether a reminder email was sent, when the reminder email was sent, how many reminder emails were sent and whether that reminder email went into a spam filter. We include an Outlook calendar invite in the confirmation email and send a reminder the day before and the hour before. These emails are text-only to reduce the probably of getting caught in spam filters.
54 minutes average attendee duration (all webinars were 60 minutes long)

Duration is impacted by how easy it is to get into the event, how interesting the topic/speaker is and whether folks stick around during a Q&A portion at the end.
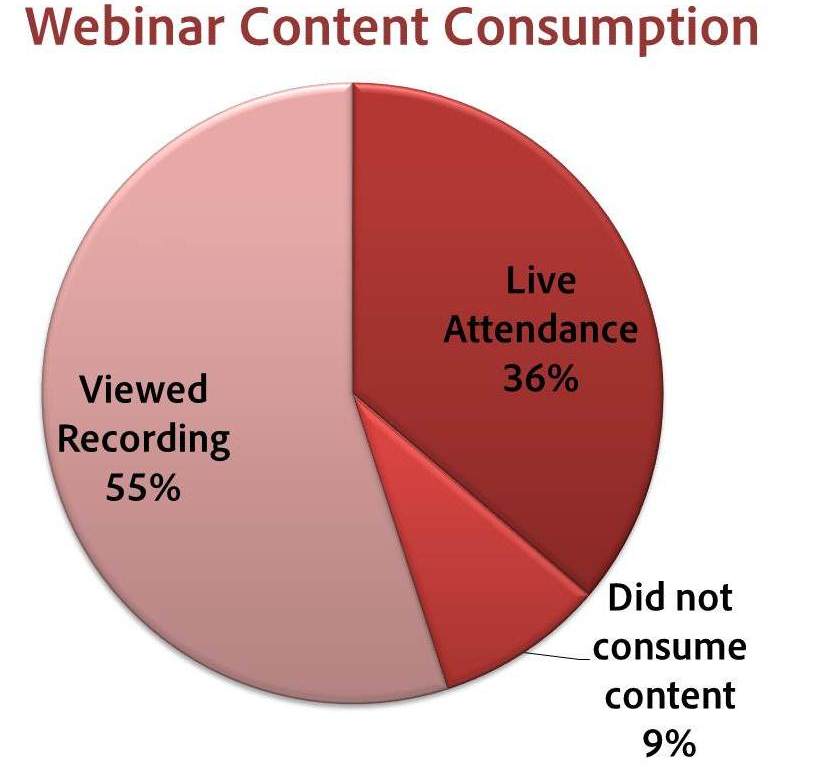
55% of registrants viewed the webinar recordings
This statistic is especially interesting when added to the average attendance rate of 36%, indicating that 91% of registrants consumed the webinar content (assuming no overlap in attendees re-watching the webinar recording). This demonstrates how important it is to record the webinar and send the recording to ALL webinar registrants.
54% of attendees on average participated in polls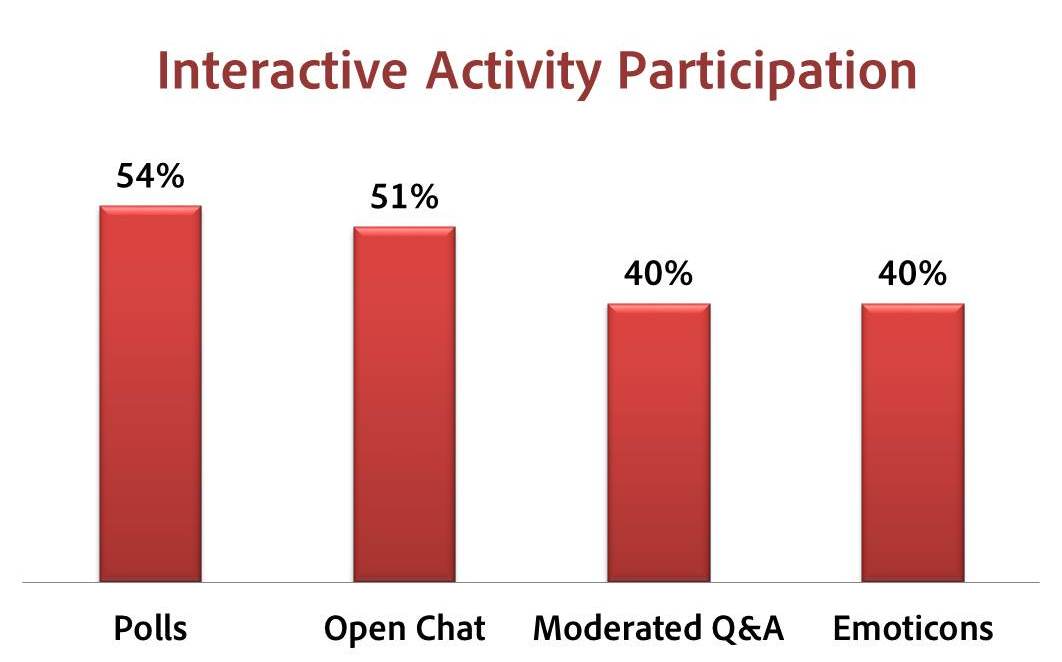
These polls were presented by the speaker during the presentation
51% of attendees on average participated in open chat
Open chat was made available for specific activities for a limited amount of time
40% of attendees on average participated in moderated Q&A
This includes technical questions as well as questions for the presenter
40% of attendees on average used the emoticons when prompted
Only about 40% of our speakers used the emoticons as a purposeful activity
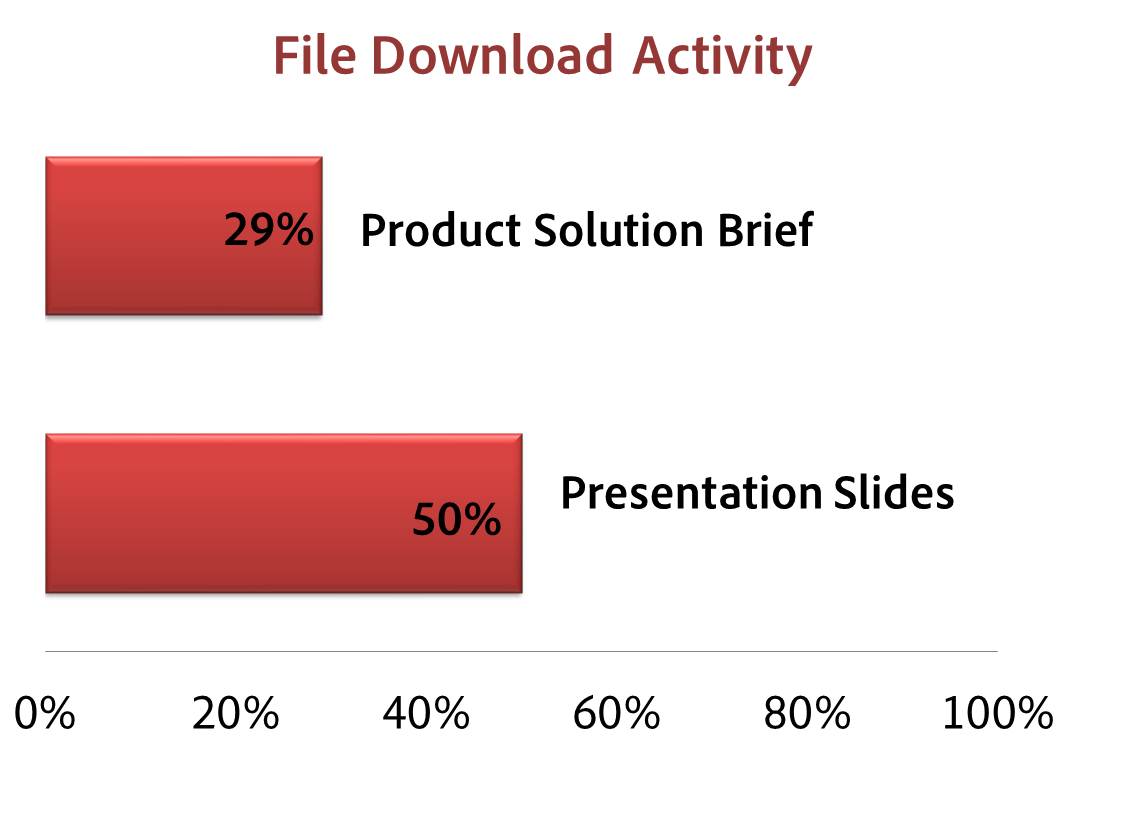
50% of the audience on average downloaded the presentation slides (if made available)
These files are downloadable directly from the live webinar as well as the webinar recording. We only measured file downloads during the live event.
29% of attendees on average download a product solution brief
This is an interesting tidbit for marketers who want to passively provide product information during a thought leadership webinar to catch shoppers early in the marketing funnel
19% of webinar attendees join a demo breakout session
At the very end of our thought leadership webinars we invite attendees to join a 5-10 minute product demo to allow prospects to accelerate themselves through the buying cycle if they are ready